2019 Historic Nebraska Flooding
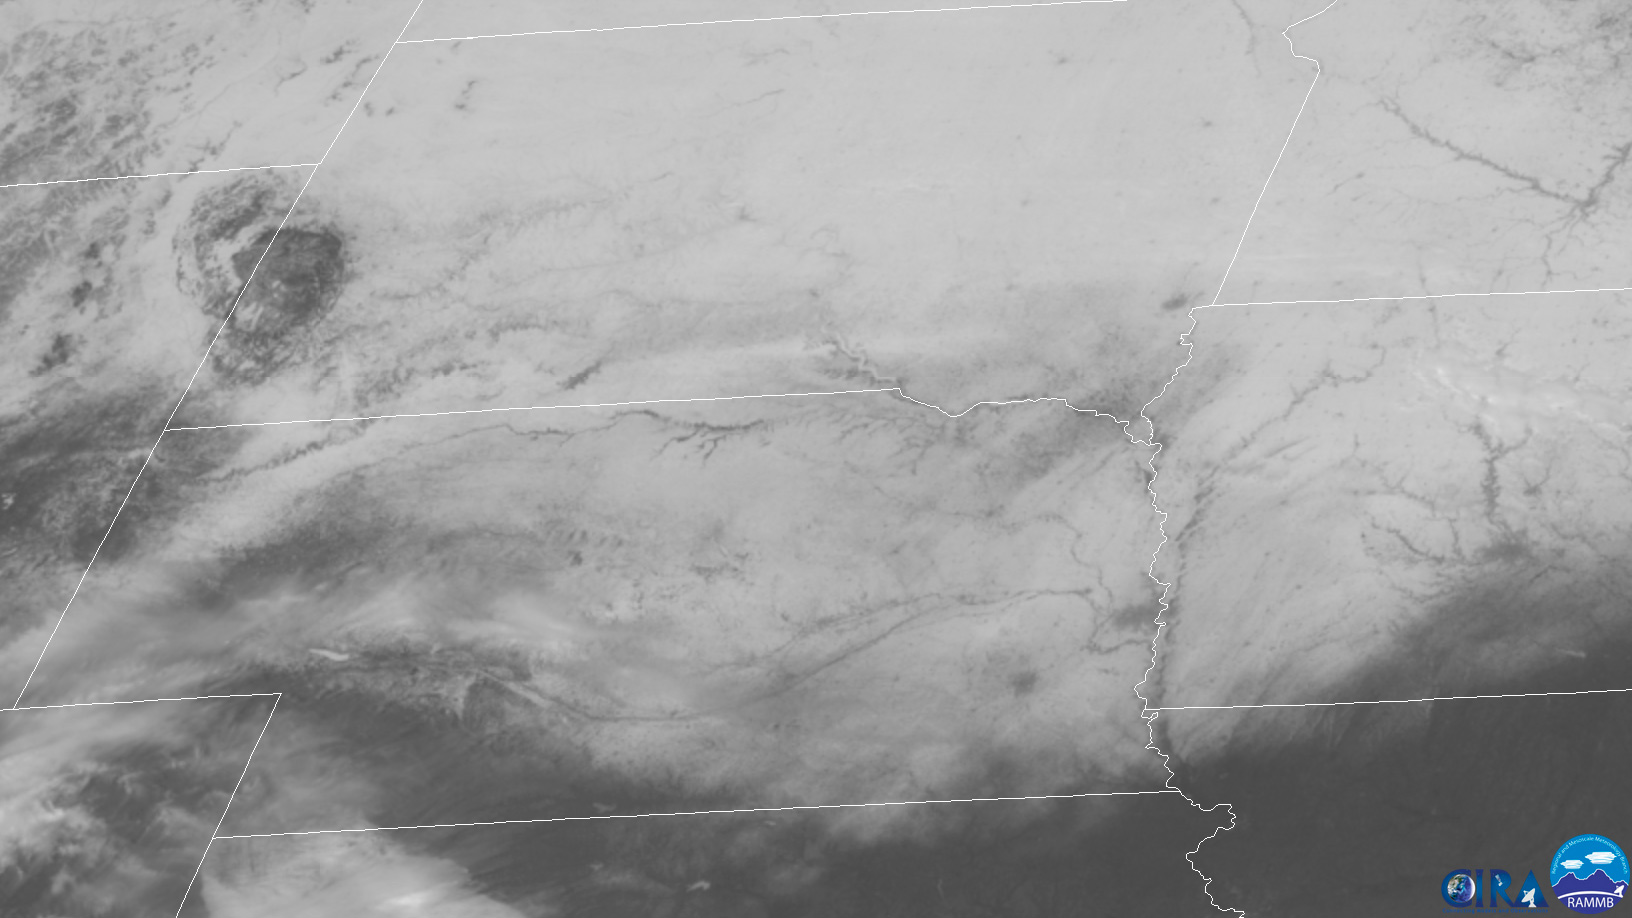
The stage was set for this historic flooding by the historic winter. Omaha broke its record snowfall for December-February, with 46 inches. It was also near record cold. So much of that snow was still on the ground, as can be seen by this satellite image a couple days before the flooding. The frost was near or even record deep, so the ground was deeply frozen. This would cause all the snow melt and rain to run off rapidly. The result would be Nebraska's worst natural disaster, so it sounds now.
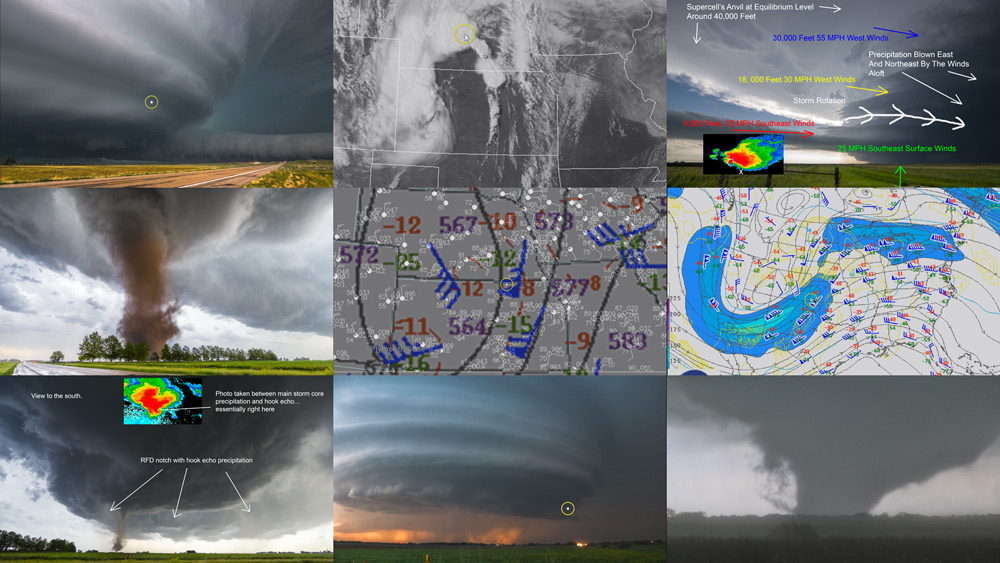
This powerful, historic storm, was actually seen well by computer models a good 10 days in advance. Often big signals(troughs) can be seen pretty far out there like this. It nearly broke the all time lowest pressure for Kansas, 971.2mb...coming in just shy at 971.9mb. It had an undisturbed gulf moisture fetch, drawing moisture north on a very intense low level jet. 80+ mph winds would occur in the Texas panhandle(note the dust), as well as on the blizzard side in Nebraska and Colorado.
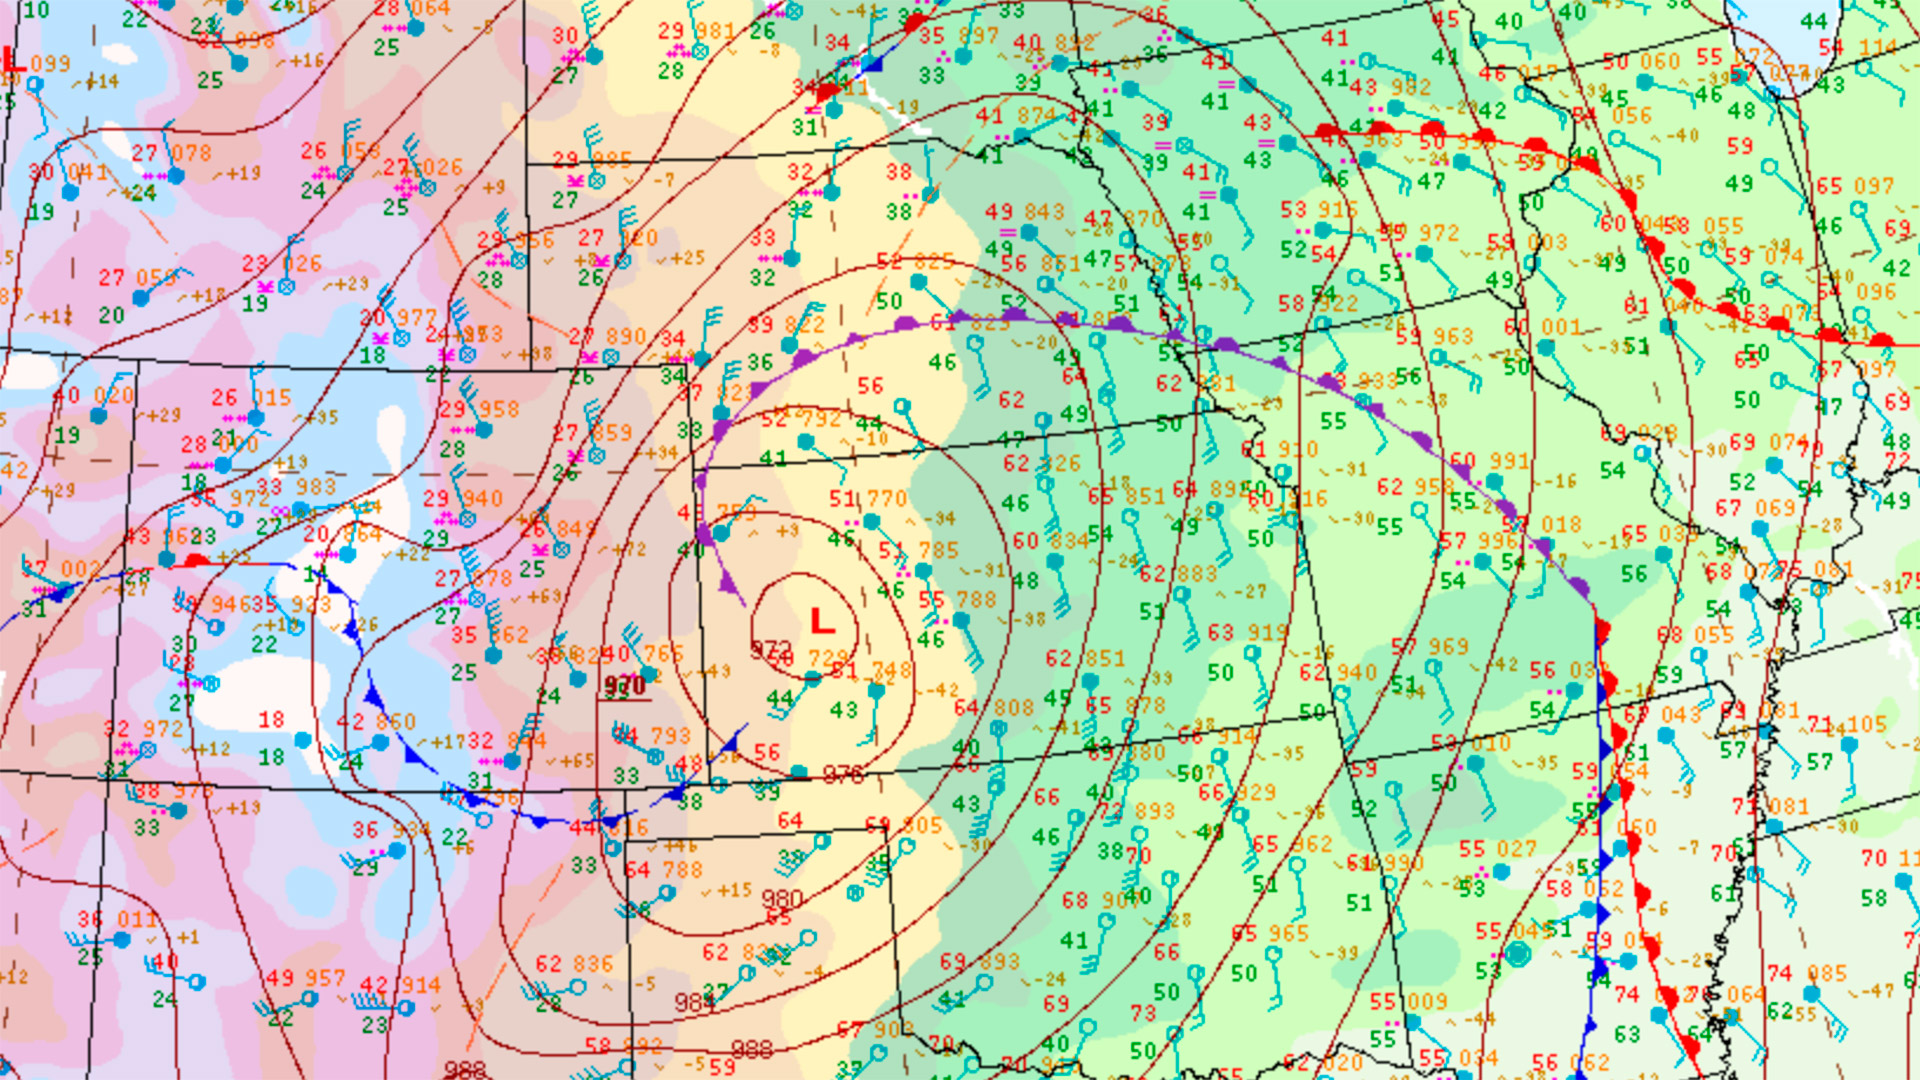
Here's the surface map in the afternoon on March 13th. Much of the rain has fallen and is falling to the north. Notice the very low pressure but mostly notice the temperatures. Mid-60F temps into southern Nebraska. The last time it reached 60 was November 1st, some 130 days before. There's also a good deal of wind. The dry slot had moved over, so there was some sun as well. The sun and wind would just quicken the melting of what snow was left after the rain. It had stopped raining a few hours and the run off in small hills was still bad. It was clear what run off I was now watching was largely snow melt in that area.
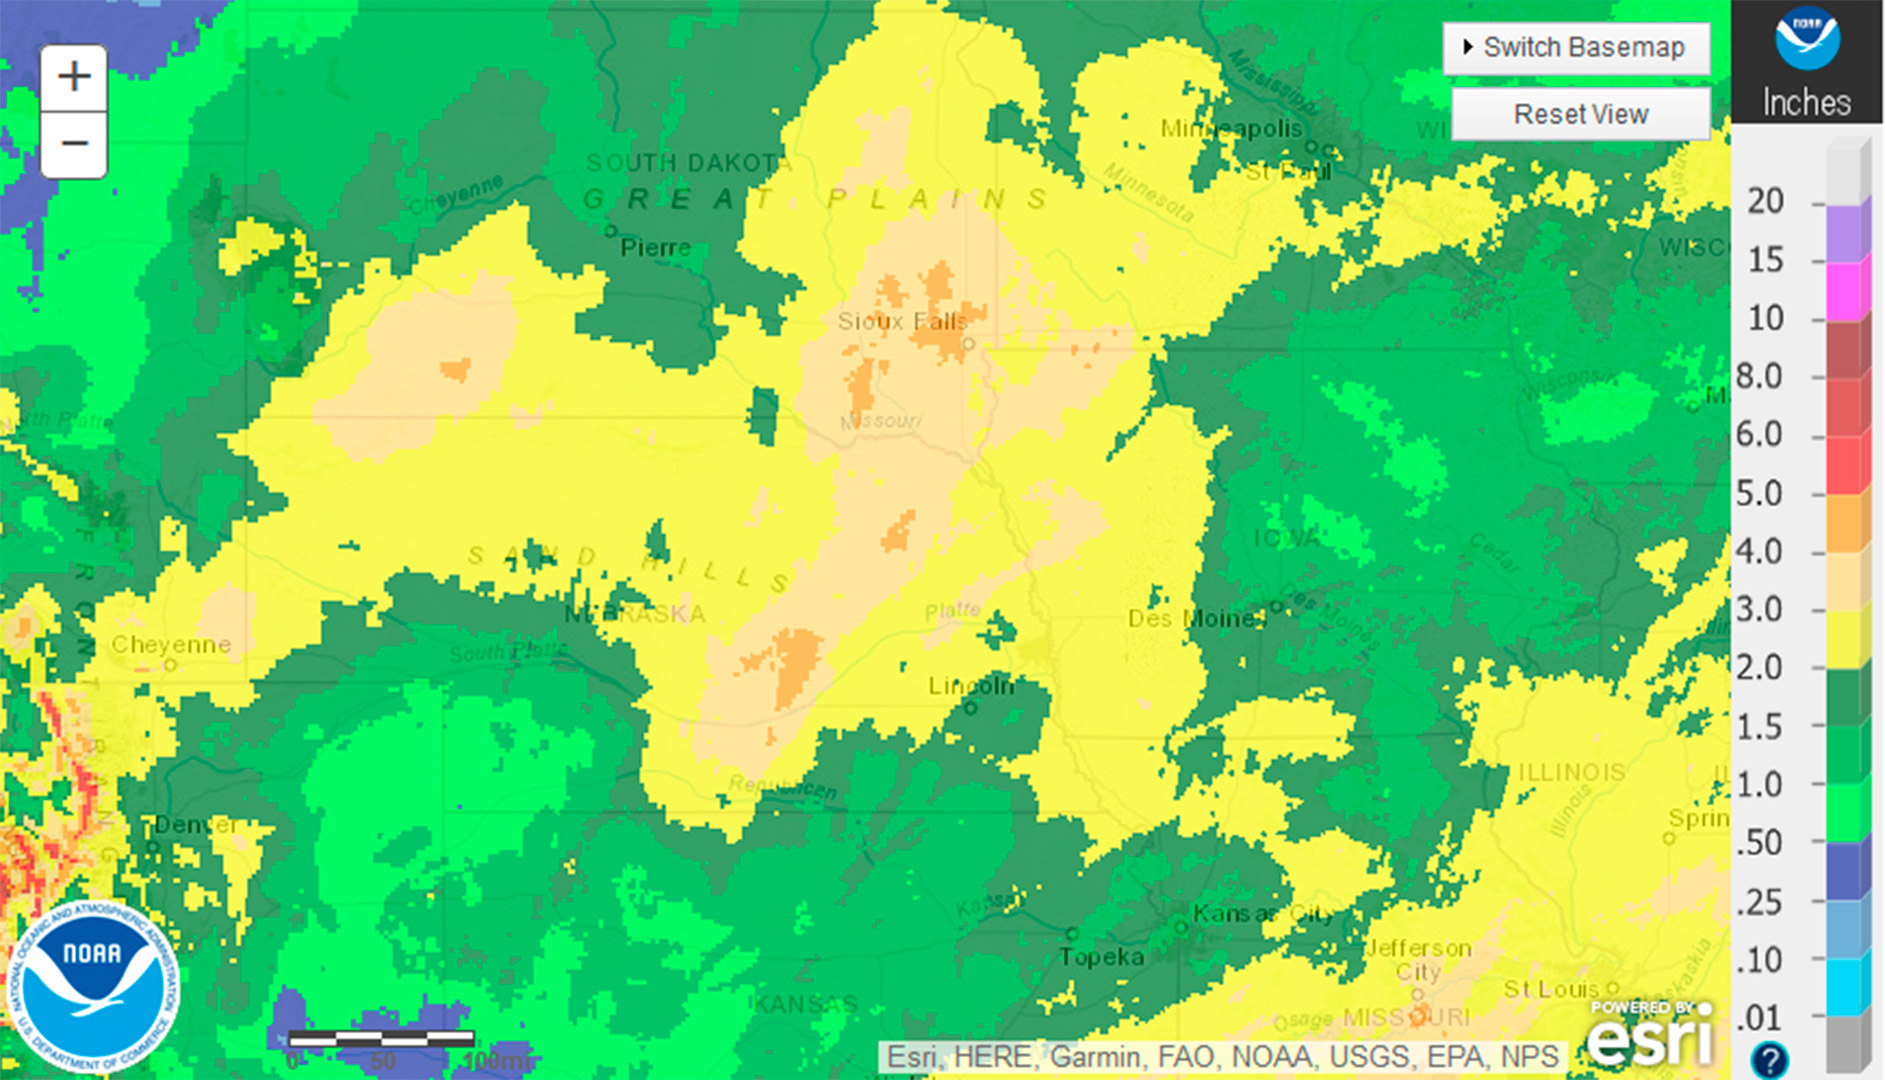
How much rain fell? The yellow is 2+ inches. With the next shades 3 and 4. Those are pretty big amounts over that large of an area. Right on top of a snow pack that was surely holding a ton of water content yet. The depth might have been collapsing in some areas, but it wasn't like it melted and ran off much yet before this. Two uniformly thick moisture sources over a large area. Be interesting if someone calculates what water content was left in the snow. I'm sure there's some idea on this. Anyway, pretty much all of it was rapidly released. And the ground wasn't going to soak up any of it.
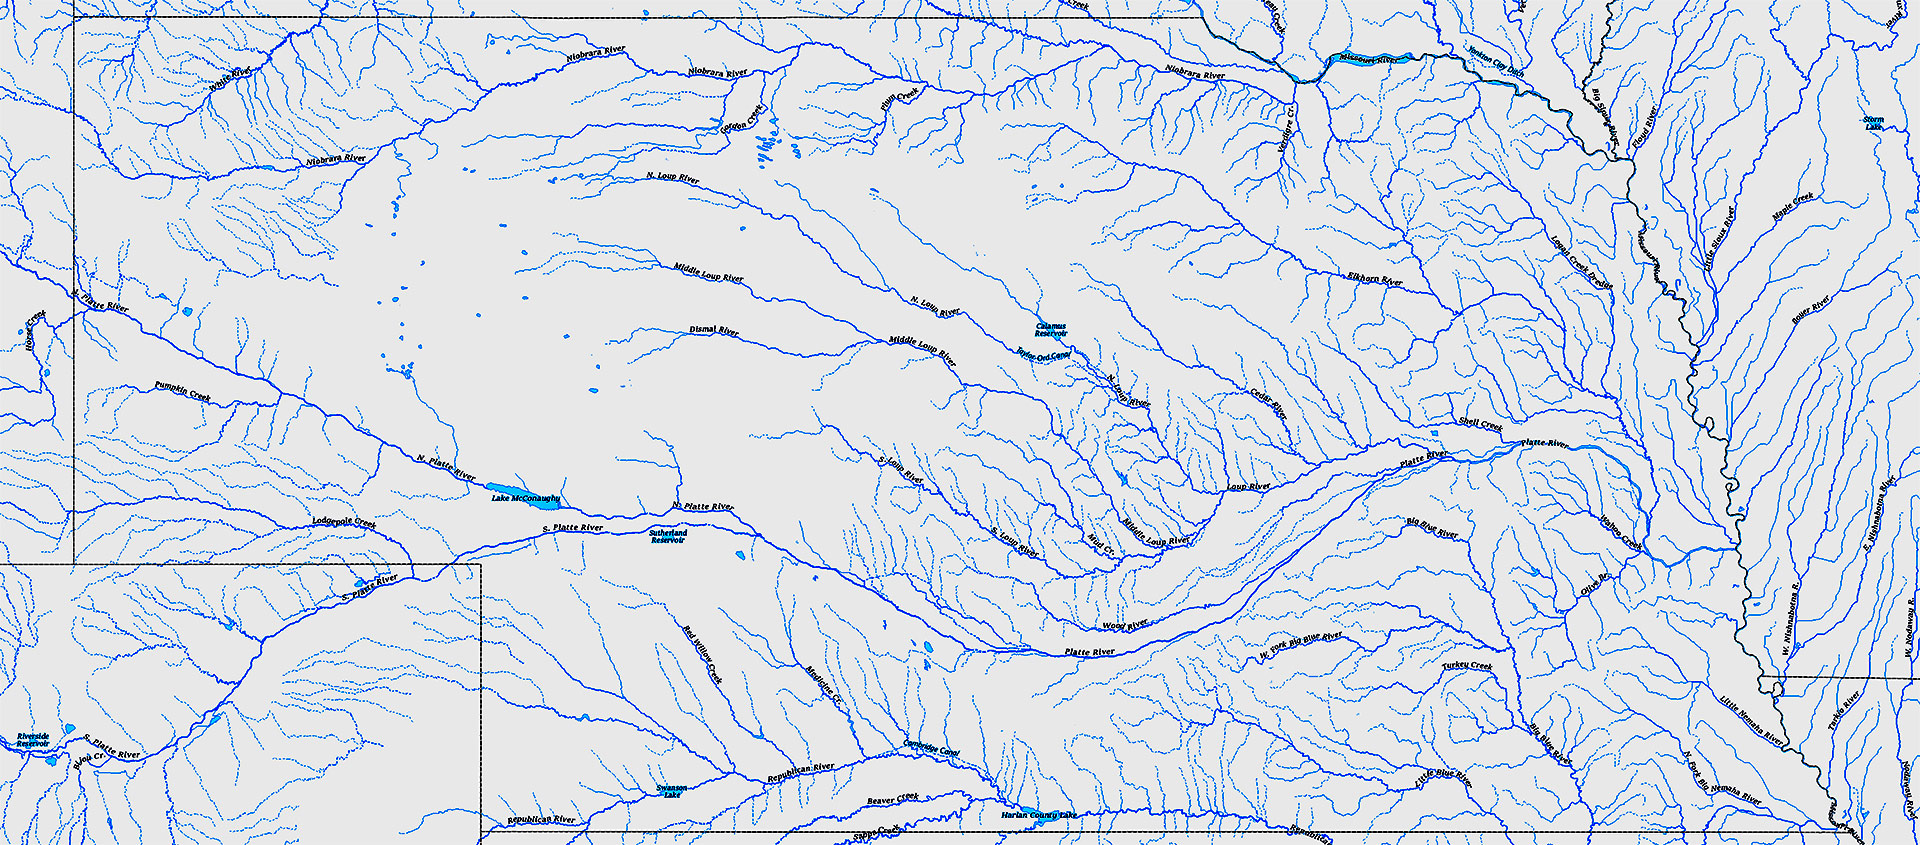
Did you know Nebraska has the most miles of rivers of any state in the US? I didn't. Most all of them joining the Platte river, which wraps around west of Omaha and dumps into the Missouri river on the south side of the city. It's telling how extreme an event it is when it starts not just breaking records on the Missouri river but doing so by feet.
The 2011 flood holds most of the records on the Missouri and it almost entirely came from Montana snow pack and a huge rainy season in May there. It wasn't happening from flooding rains here. So the effects from that were largely just along the Missouri. Not this one. Most every stream in there in eastern Nebraska was flooding record bad this time.
Here are several river levels. You'll probably have the pause the video to look at them. Each one pops up in 3 seconds. Almost made this a gif but figured one would want the ability to pause it. This is absolutely crazy. Consider all but the first one dumps into the Missouri after Gavin's point dam. All time records being smashed on many of them.
And about Gavin's point releases. 2011 they released at 160,000 cubic feet per second. The record before that was 70,000 cfs in 1997. This time they had to release at 90,000 cfs. So a lot. So imagine in 2011 it's basically 160,000cfs from the dam in the Missouri and that's about it. This time it's 90,000 but all those other rivers at record flooding with it, entering downstream of the dam.
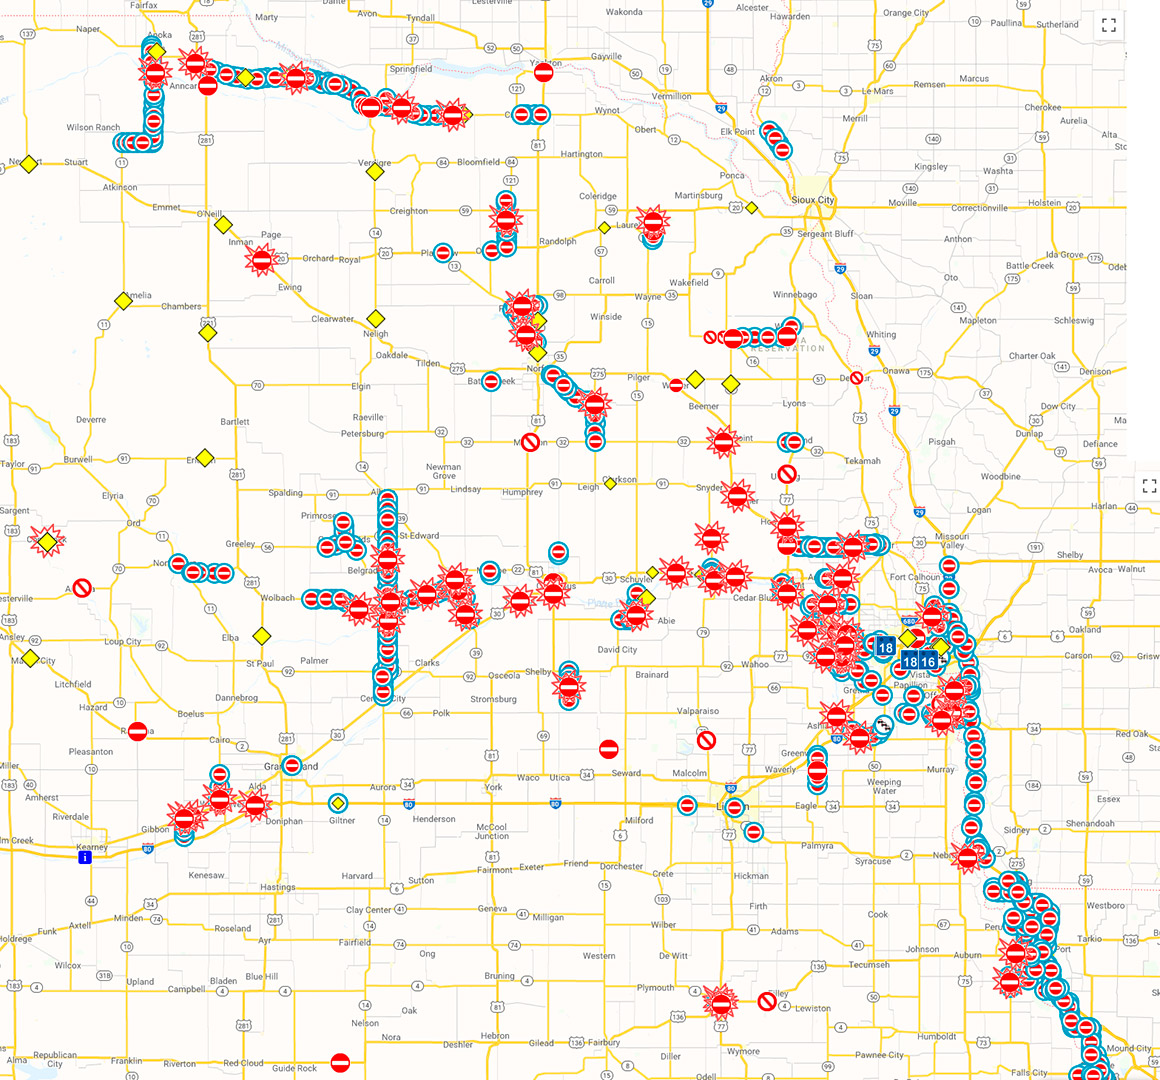
Days after it and the road situation is just bad. Extremely widespread road closures.
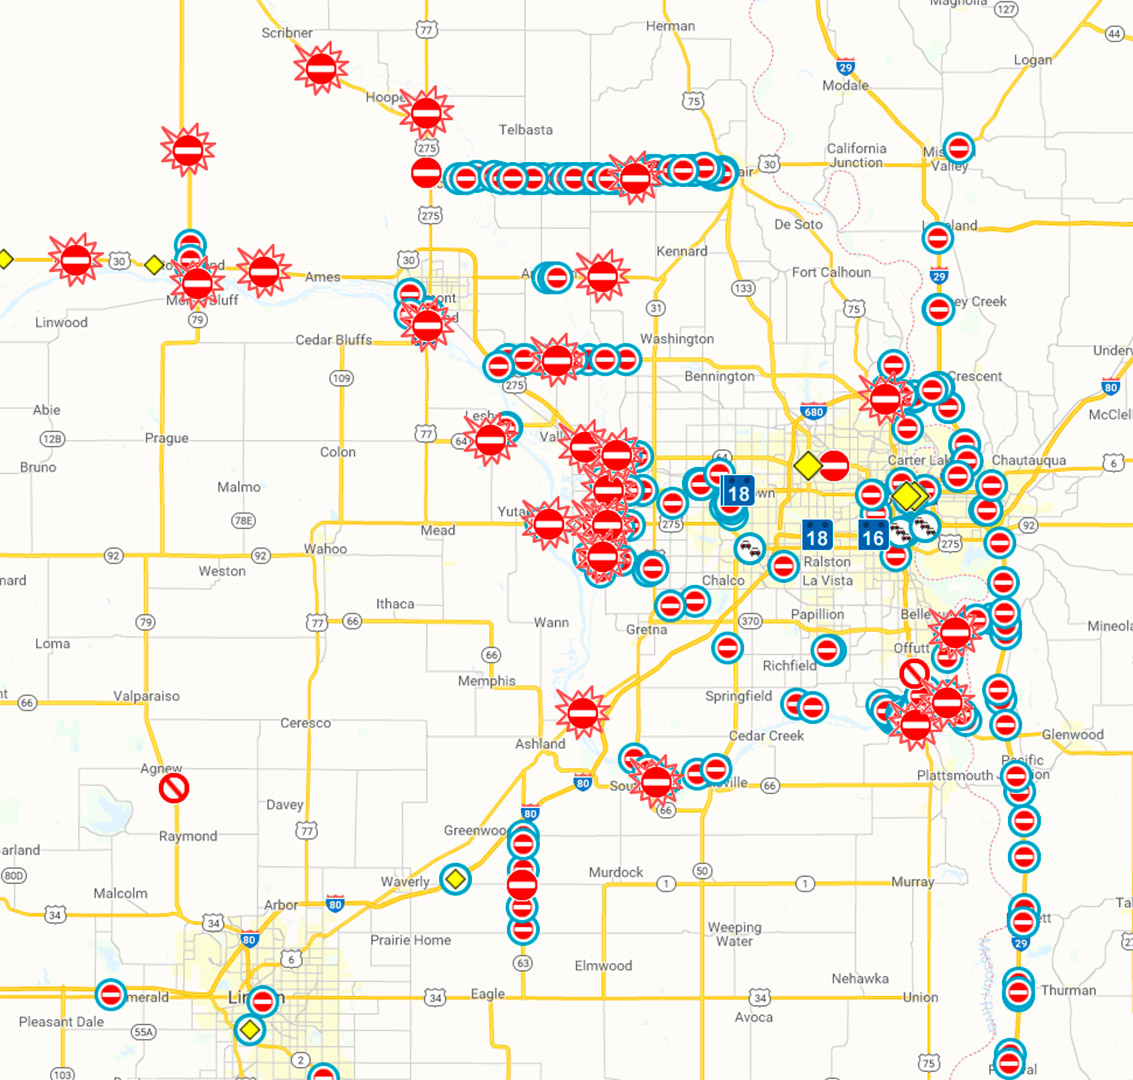
A closer look at Omaha. Just imagine if you lived west of the Elkhorn and Platte and commute to Omaha. Everyone must be going down to Ashland together on I80. Some cities have become islands with no way in or out now.
Before and after of the rivers around Omaha.
Since some wonder why it's green, it's just one of the options for viewing. There are many. They use different wavelengths and various processing methods depending on what one is wanting to see. The problem with the "natural color" option is simply brown water around brown ground stands out way less. CLICK HERE to see an example using that.
Before and after of the rivers around Fremont.
Before and after of the rivers around highway 275. So that thing turned into a mile wide river, just look at the square grids in there(right click view image will show it larger) Then on the map down lower on the page, look at number 13 located there and click and watch that video. Not just wide but all of it readily flowing. That alone is just crazy.
Here is a closer one of Omaha with the streets labeled. I also tried it in the natural color one and boosted the contrast as the separation was much harder to see otherwise. I think I still like the false color green/blue versions for looking at where the water is.
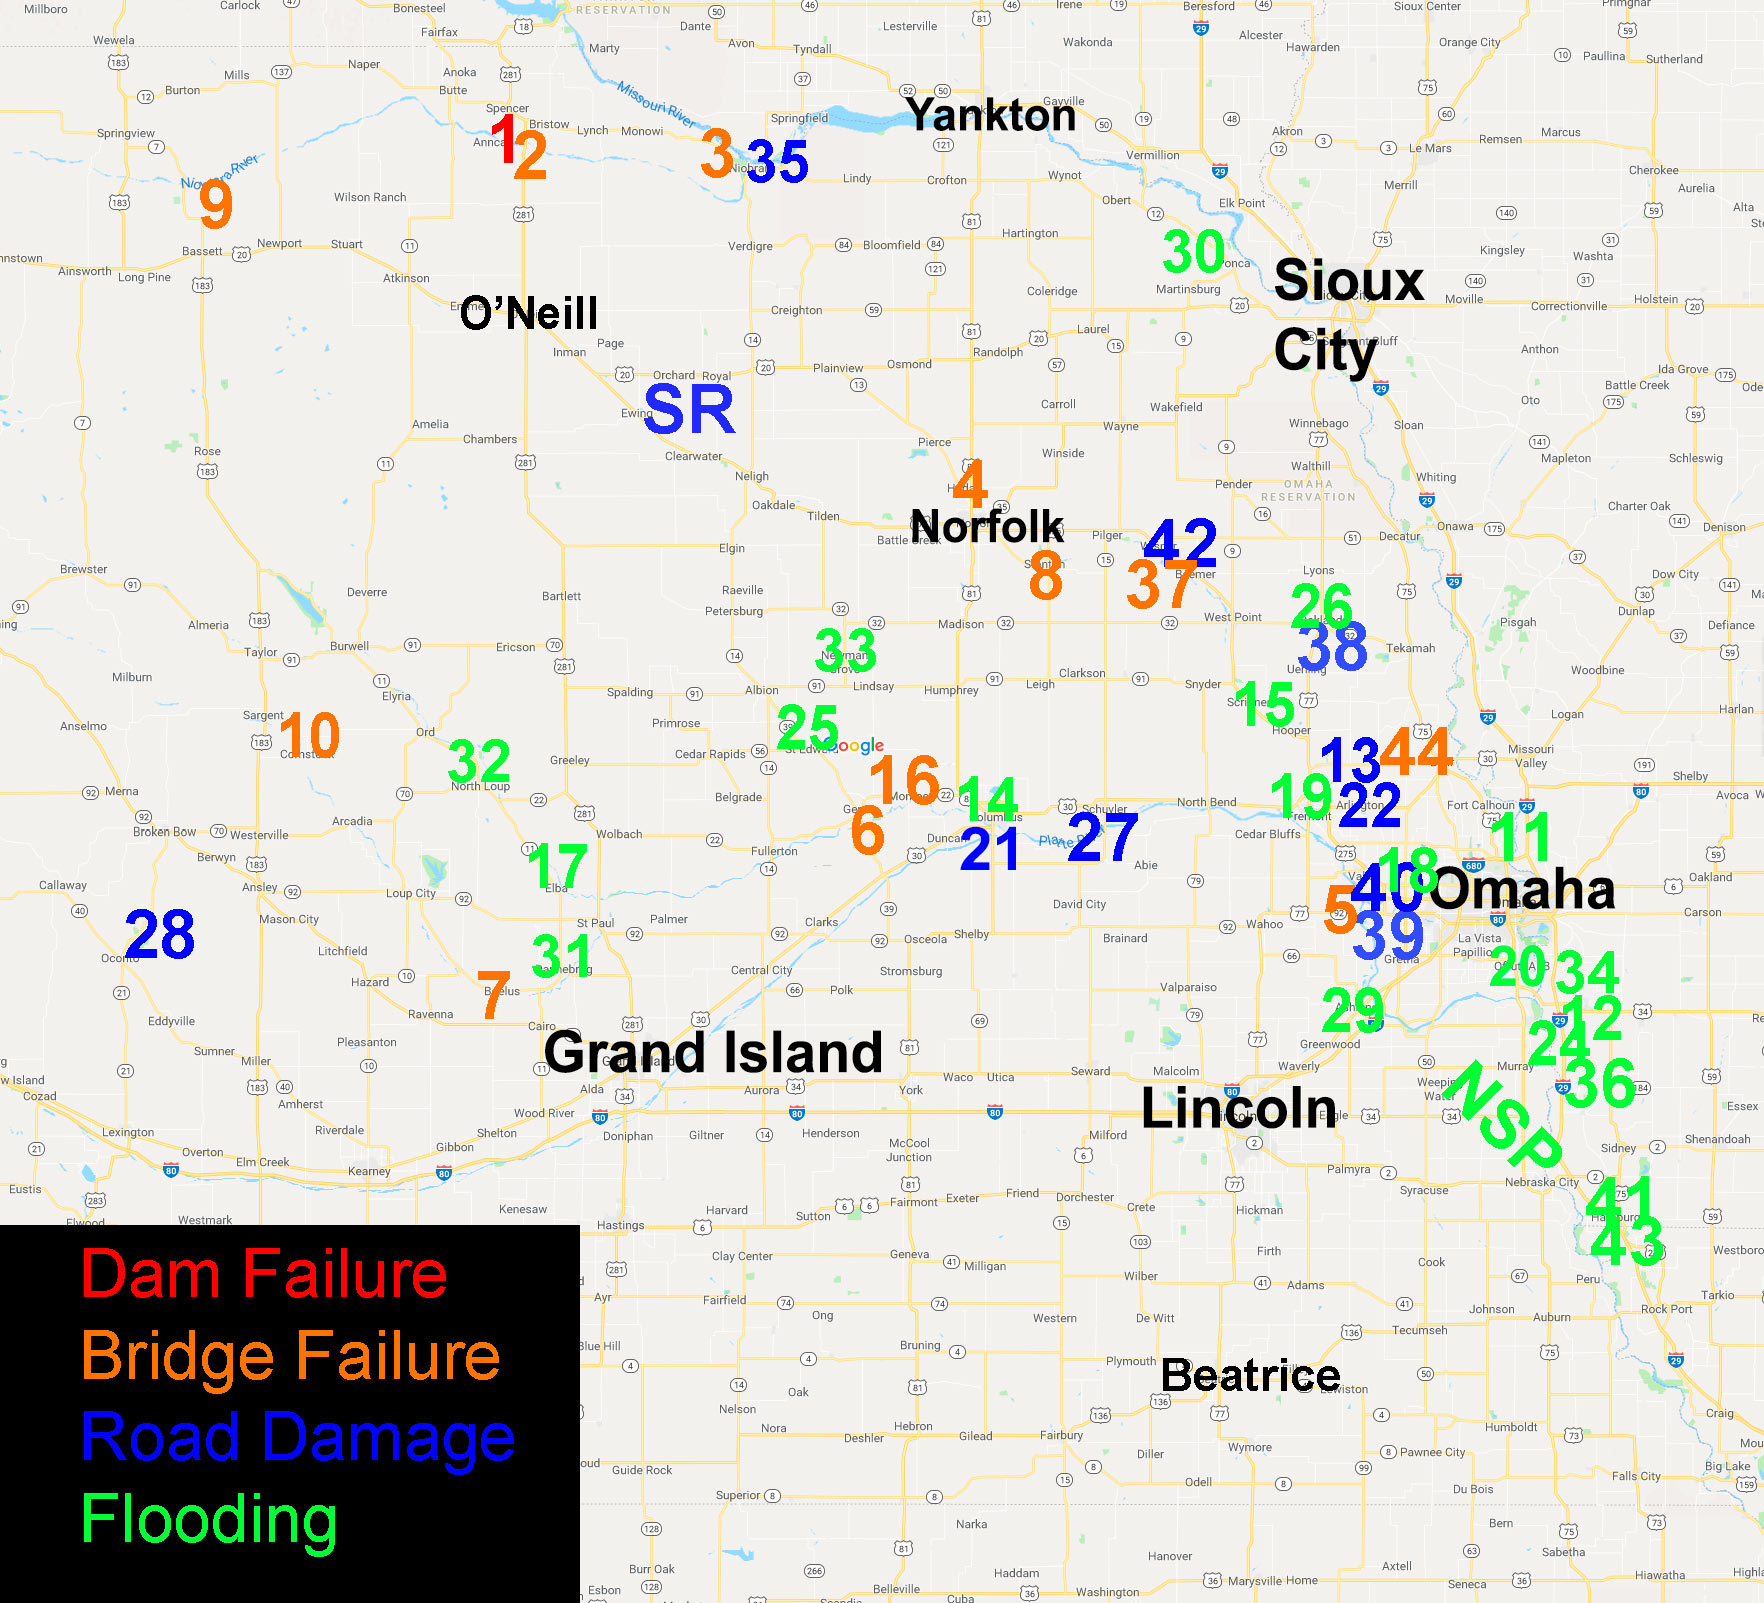
- 1 2 3 4 5 6 7 8 9 10 11 12 13 13 14 15 16 17 18 19 20 21 22 22 23 24 25 26 27 28 29 30 31 32 33 34 35 36 37 38 39 40 41 42 43 44 SR NSP
So this is a work in progress and the main reason I put the page together. I've been trying to grasp how widespread and bad things are and it's overwhelming. Each link is tied to the number and will click out into a new tab for that damage from there. It's also color coded for the type. I got a lot of the bridges but I'm sure I'm missing some. It's so bad and so widespread. It would take some time to go over all those links, but there they are if one wants. I tried picking either government/state related ones or business/tv, just because then they are probably the least likely to vanish.
I will add more. Might take a bit of time as this has already taken a couple days to do what is on here. There's also surely a better way to display it, but the image map idea doesn't seem to have worked wonderfully on phones in the past when I did it. This was effective and I can at least get it started.
Some of the flooding locations now have damage images with them as well. So if you see two of the same numbers, there's a link for each there.